Mark Thoma at Economist's View says:
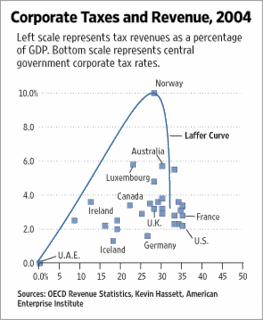
The Wall Street Journal says Kevin Hassett has discovered the Laffer curve, but I think these data might say something else. Here's the picture from the editorial where they are making their usual plea for more tax cuts:

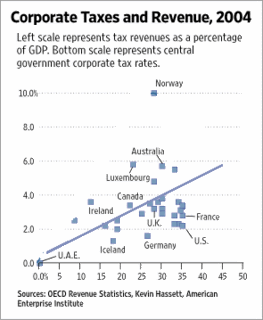
The blue line is supposed to be the Laffer curve, but this is far from compelling. Since it looks like all that's been done here is to draw a line through an outlier, Norway (an outlier that in other contexts we are told to ignore because it is an outlier, e.g. see below), and since this is clearly not the best fitting line to these data, here's another possibility:

More discussion at PZ Myers at Pharyngula, Sean at Cosmic Variance, and Brad DeLong.
4 comments:
For anyone who survived Reaganomics, it is spelled "laugher curve."
I would also point out that while the announced US corporate tax rate is 35%, the effective rate is closer to 26%.
Norway is an obvious outlier and no reputable statistician would bend the entire curve to fit one odd data point.
Being slow to grasp basic economics, I appreciate such info, Bryan. The angle I come in on is that people are making the numbers say what they want for the ideology they believe in.
Did we ever have a country not so horribly polarized? Did we ever have economics that was not forced to be partisan? Does the Wall Street Journal think that nobody notices such crap?
The Civil War period was more polarized, followed by Vietnam.
Given that modern "scientific" economics was in many ways founded by Karl Marx, economics will remain polarized until we have enough data to figure out how things work. With little more than a century of data, anything could be true, but nothing is actually known. They handed out a Nobel for applying "game theory" to economics, so things are pretty iffy.
The WSJ makes its money agreeing with the prejudices of the people who buy it. If it's good for their readers it must be true.
And now that WSJ is owned by Murdock, there'll be even more 'truthiness'....
Post a Comment